Use labor-market figures to set context for a client conversation, and recruiting-platform data to ask questions about your own funnel. They describe different populations and periods, so keep that context beside any number you quote. This is a snapshot checked in mid-October 2026; follow the source links for later releases.
US labor market
Scroll the table to see all columns →
| Figure | Measure and data period | Source |
|---|---|---|
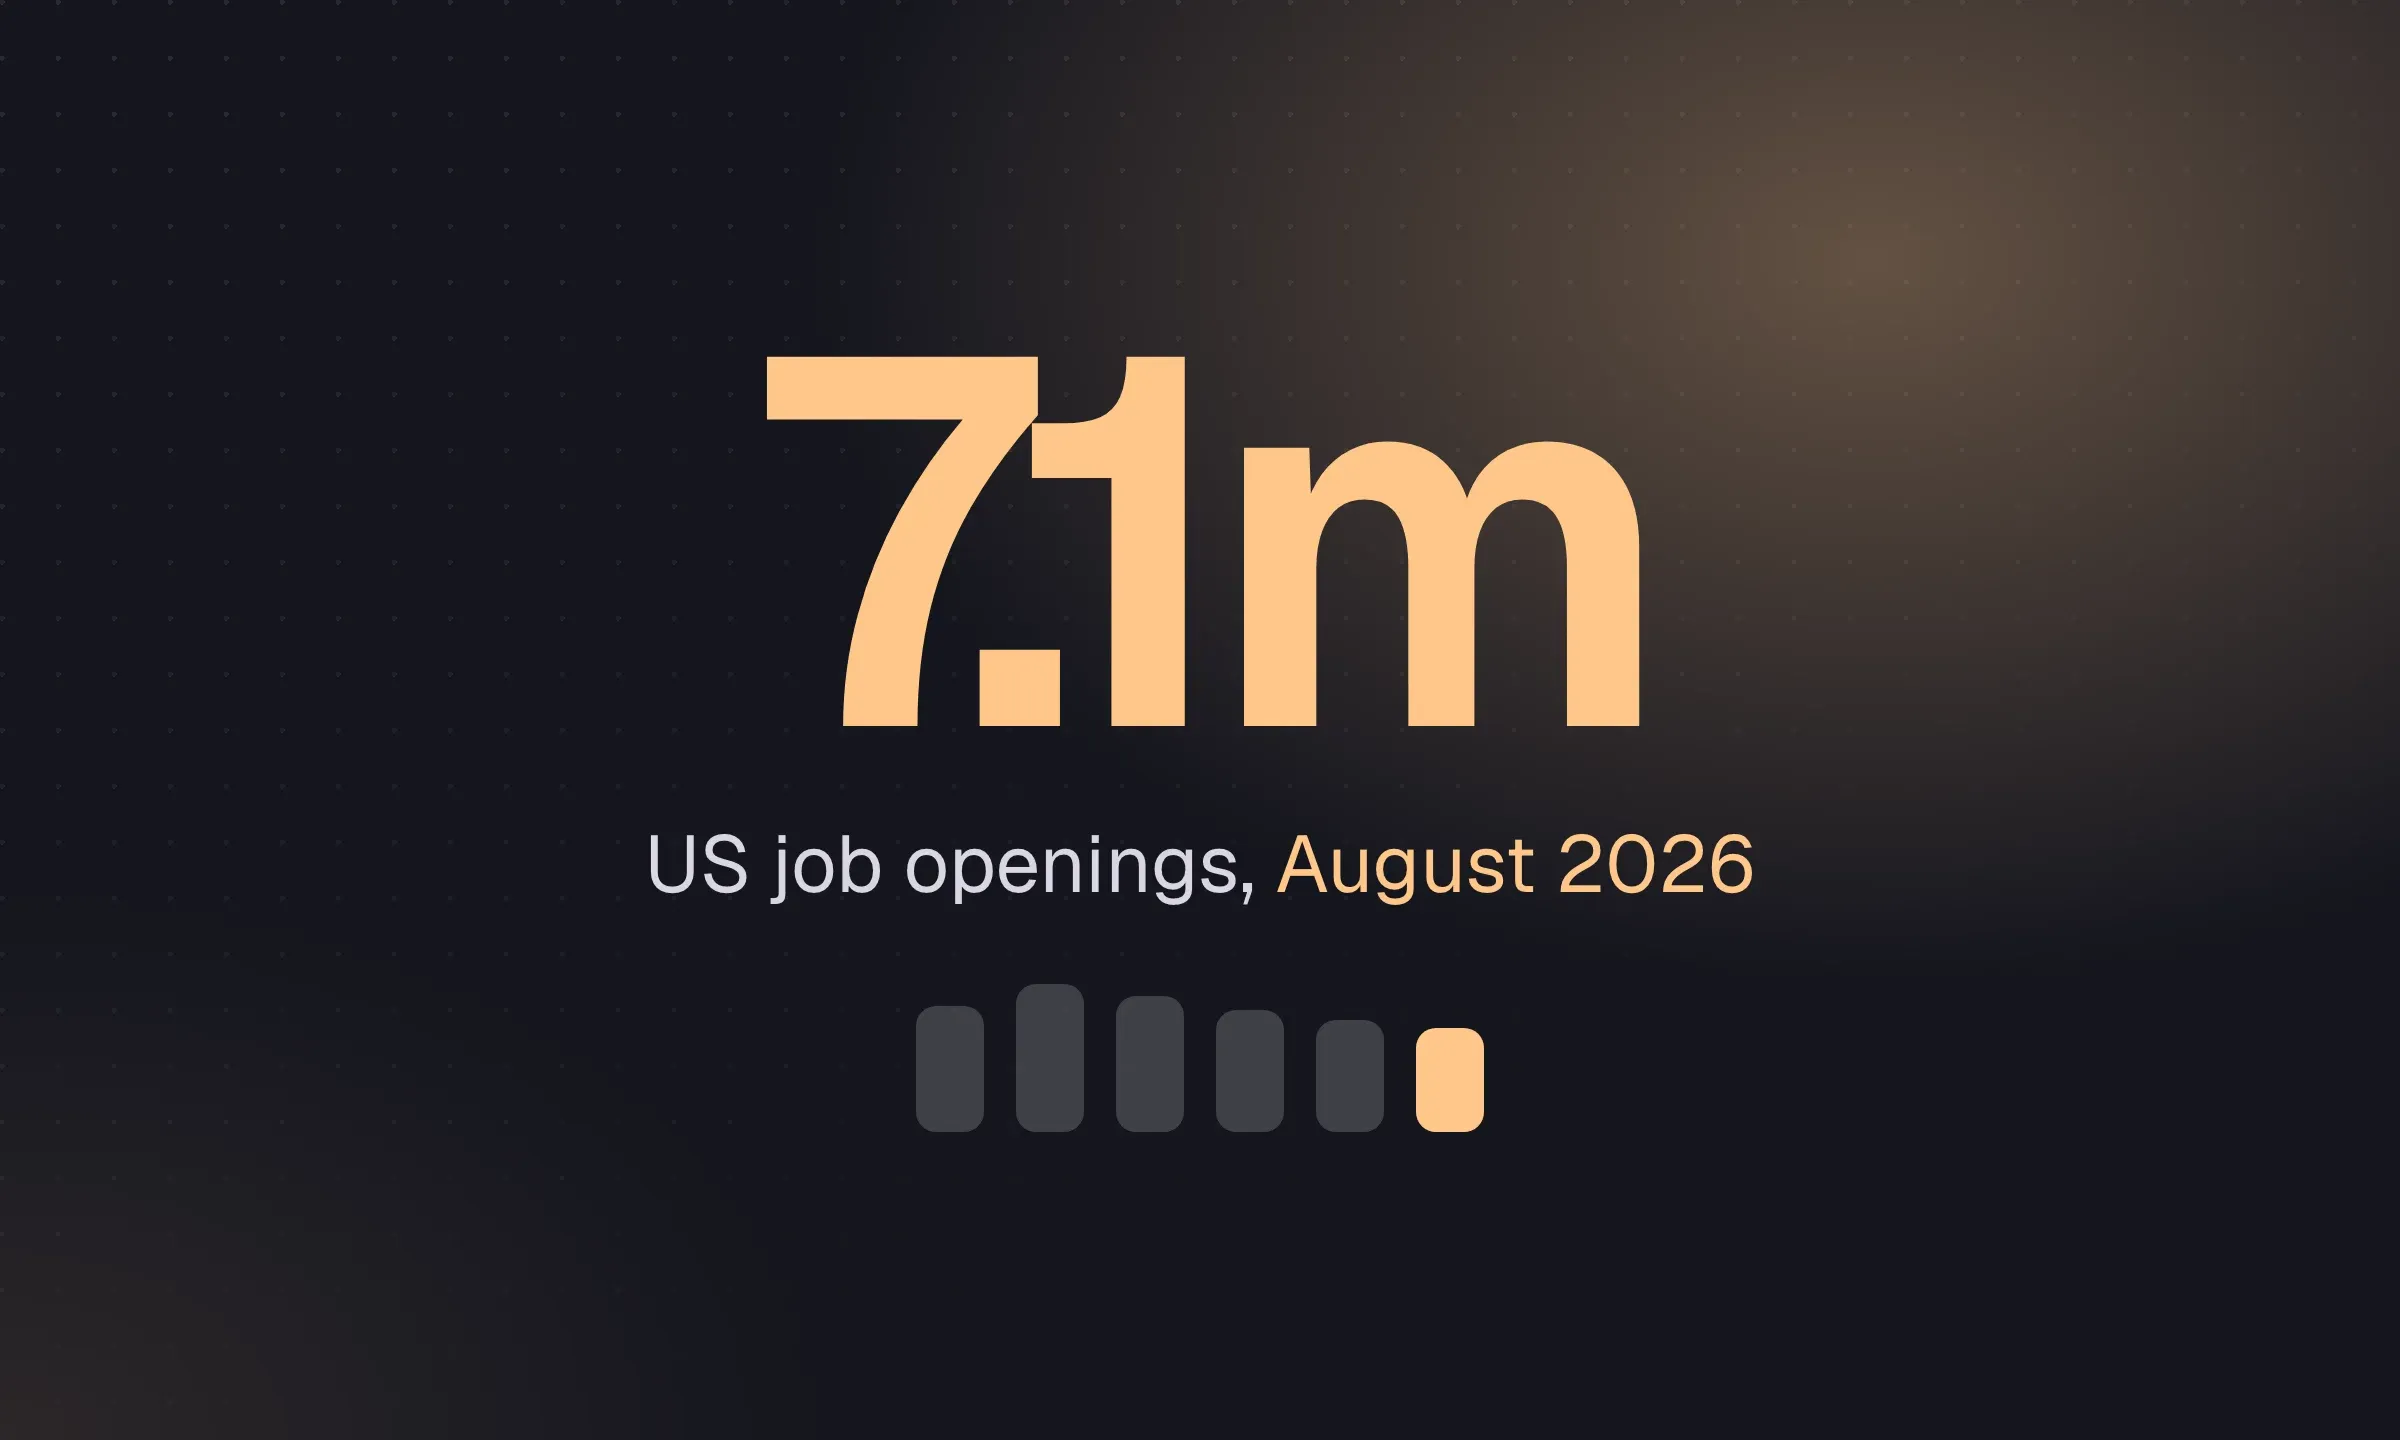
| 7.1m | job openings in August 2026, an openings rate of 4.3% | BLS JOLTS |
| 5.2m | hires in August 2026, little changed on the month and the year | BLS JOLTS |
| 1.9% | quits rate in August 2026, down from 2.0% a year earlier | BLS JOLTS, table 4 |
| 4.2% | unemployment rate in September 2026 | BLS Employment Situation |
Openings in August 2026 were 7.08 million, down from 7.34 million in July but slightly above the 6.92 million of August 2025, according to JOLTS table 1. Layoffs and discharges were 1.6 million, a rate of 1.0%.
What this means on the desk: a low quits rate means fewer people are leaving jobs on their own initiative. Candidates are harder to move, counter-offers are more likely to land, and the “why now” part of your candidate qualification matters more. Payroll growth was also weak, with the September 2026 jobs report showing payroll employment up just 29,000.
UK labor market
Scroll the table to see all columns →
| Figure | Measure and data period | Source |
|---|---|---|
| 702,000 | vacancies in June to August 2026, down 8,000 on the quarter and the lowest since February to April 2021 | ONS |
| 10.9% | below the pre-pandemic vacancy level of January to March 2020, a gap of 86,000 | ONS |
| 4.9% | unemployment rate in May to July 2026, up 0.2 points on the year | ONS labour market overview |
| 101,000 | fewer payrolled employees in July 2026 than a year earlier, a 0.3% fall | ONS |
The agency view from the KPMG and REC UK Report on Jobs for September 2026 is more encouraging than the official data:
- Permanent placements rose marginally, the strongest rise in four years and the second monthly increase in a row.
- Temp billings grew, though at the slowest pace in five months.
- Vacancies still fell, but at the weakest rate in over two years.
- Candidate availability kept rising, at the slowest pace in three years.
- Permanent starting salaries grew more slowly for the first time in four months.
For UK agencies, that combination usually means more candidates per role, tougher fee negotiations and clients who take longer to commit, with early signs that perm activity is stabilizing. A tight focus on clients who are still hiring is more productive than broad outreach; the client acquisition playbook covers how to find them through hiring signals.
Staffing industry
Scroll the table to see all columns →
| Figure | Measure and data period | Source |
|---|---|---|
| 2.2m | temporary and contract employees worked for US staffing companies in an average week in 2024 | American Staffing Association |
| 12.7m | temporary and contract employees hired by US staffing companies over the course of 2023 | ASA |
| 3.3% | year-on-year growth in US staffing revenue in Q2 2026, with staffing employment up 0.6% | ASA |
| 2.49m | jobs in US temporary help services in September 2026, seasonally adjusted | BLS, table B-1 |
The weekly ASA Staffing Index stood at 93 for the week of September 7–13, 2026, up 3.3% on the same week in 2025, with the four-week average up 5.8% year on year. BLS temporary help employment was 2,486,800 in September 2026, down 10,900 on the month but up from 2,471,600 in September 2025.
Temporary help is traditionally one of the first sectors to turn when the economy changes direction, because employers add temps before committing to permanent headcount. A modest year-on-year rise, after a long decline, is a cautiously positive sign for contract desks. If you are weighing whether to add contract to a perm business, the guide to starting a recruitment agency covers the funding a contract book needs.
Job postings and pay
Scroll the table to see all columns →
| Figure | Measure and data period | Source |
|---|---|---|
| 103.5 | Indeed US Job Postings Index on September 18, 2026, about 3% above the pre-pandemic baseline | Indeed Hiring Lab |
| −8.1% | year-on-year change in Indeed UK job postings to September 18, 2026, leaving the index at 69 | Indeed Hiring Lab UK |
| 3.5% | UK regular pay growth in May to July 2026; 0.6% after inflation (CPIH) | ONS |
| 16.9% | of UK postings mentioned remote or hybrid work at the end of June 2026 | Indeed Hiring Lab UK |
Indeed’s US index rose 0.7% on the year, which Hiring Lab described as the first positive annual reading in almost four years. Posted wages, tracked by the Indeed Wage Tracker, grew 2.5% in the US in the year to August 2026 and 4.0% in the UK, where growth has been essentially unchanged for six months.
For agencies, slower posted-wage growth makes salary negotiations easier for clients and harder for candidates who expect big jumps for moving. Test candidates’ salary expectations against current postings before you submit them, not against what the market paid in 2022.
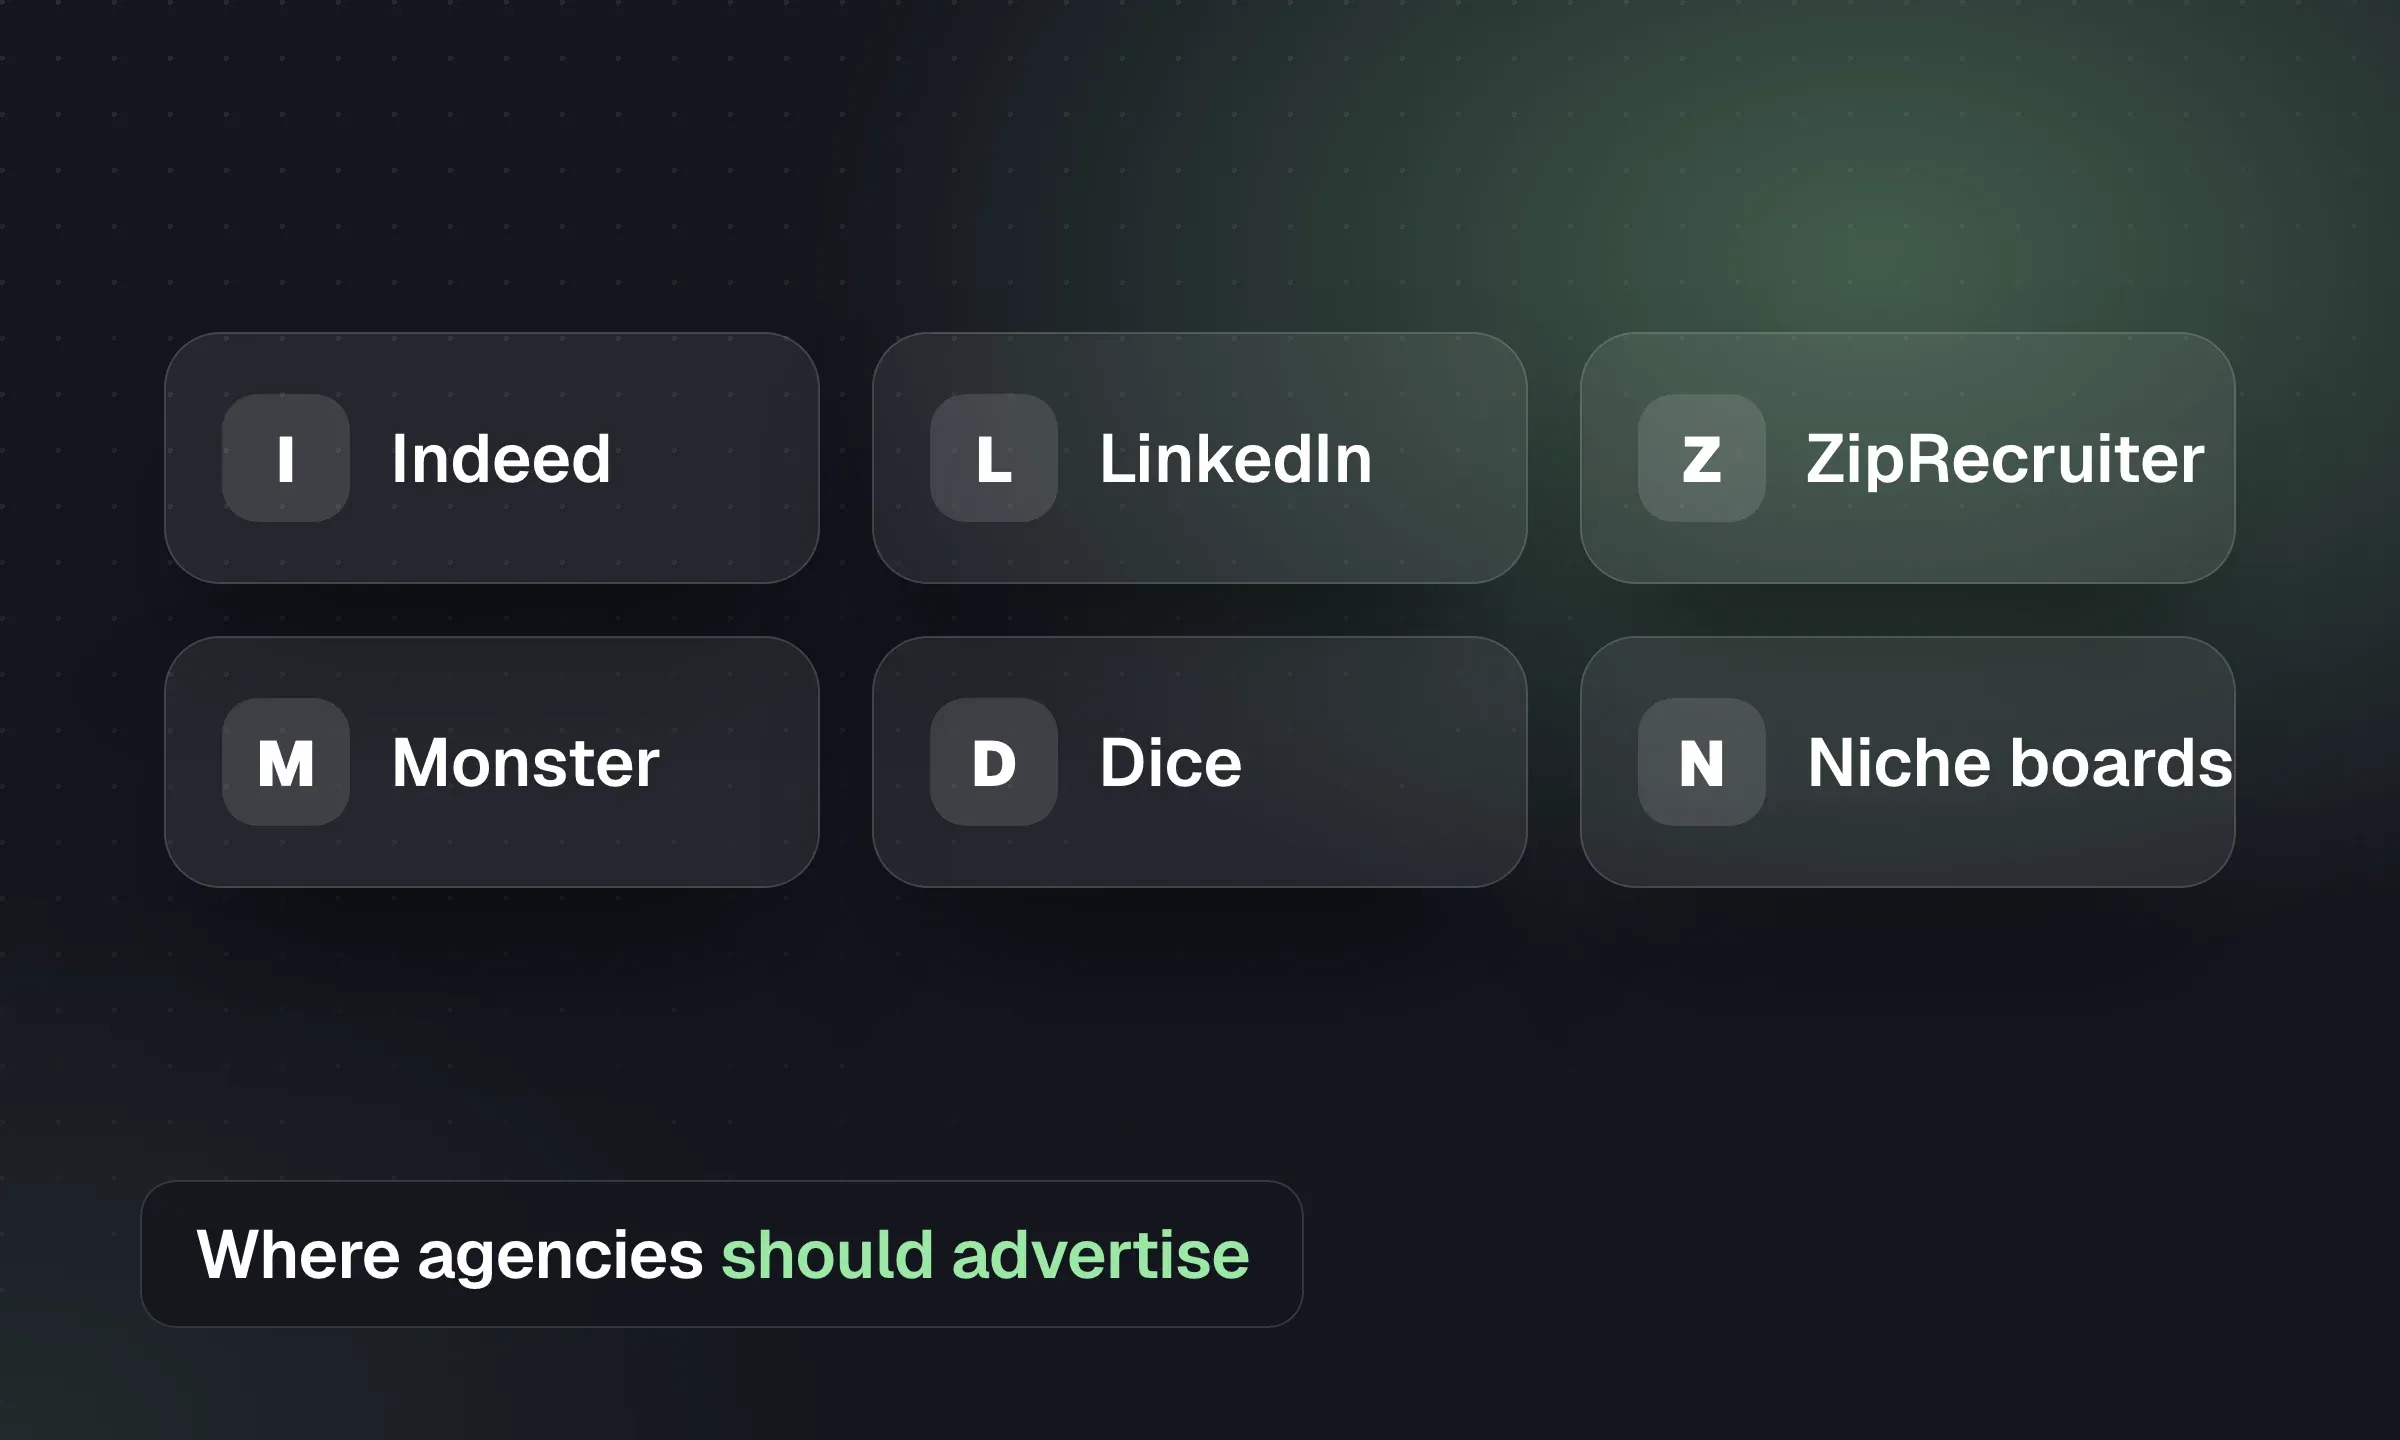
The postings data also shows how uneven the two markets are. If you recruit on both sides of the Atlantic, the best job boards guide and the UK job boards guide cover where to advertise in each.
Recruiting funnel benchmarks
Scroll the table to see all columns →
| Figure | Measure and data period | Source |
|---|---|---|
| 291 | applications per hire in Ashby’s data to March 2026, compared with roughly 100 in early 2021 | Ashby |
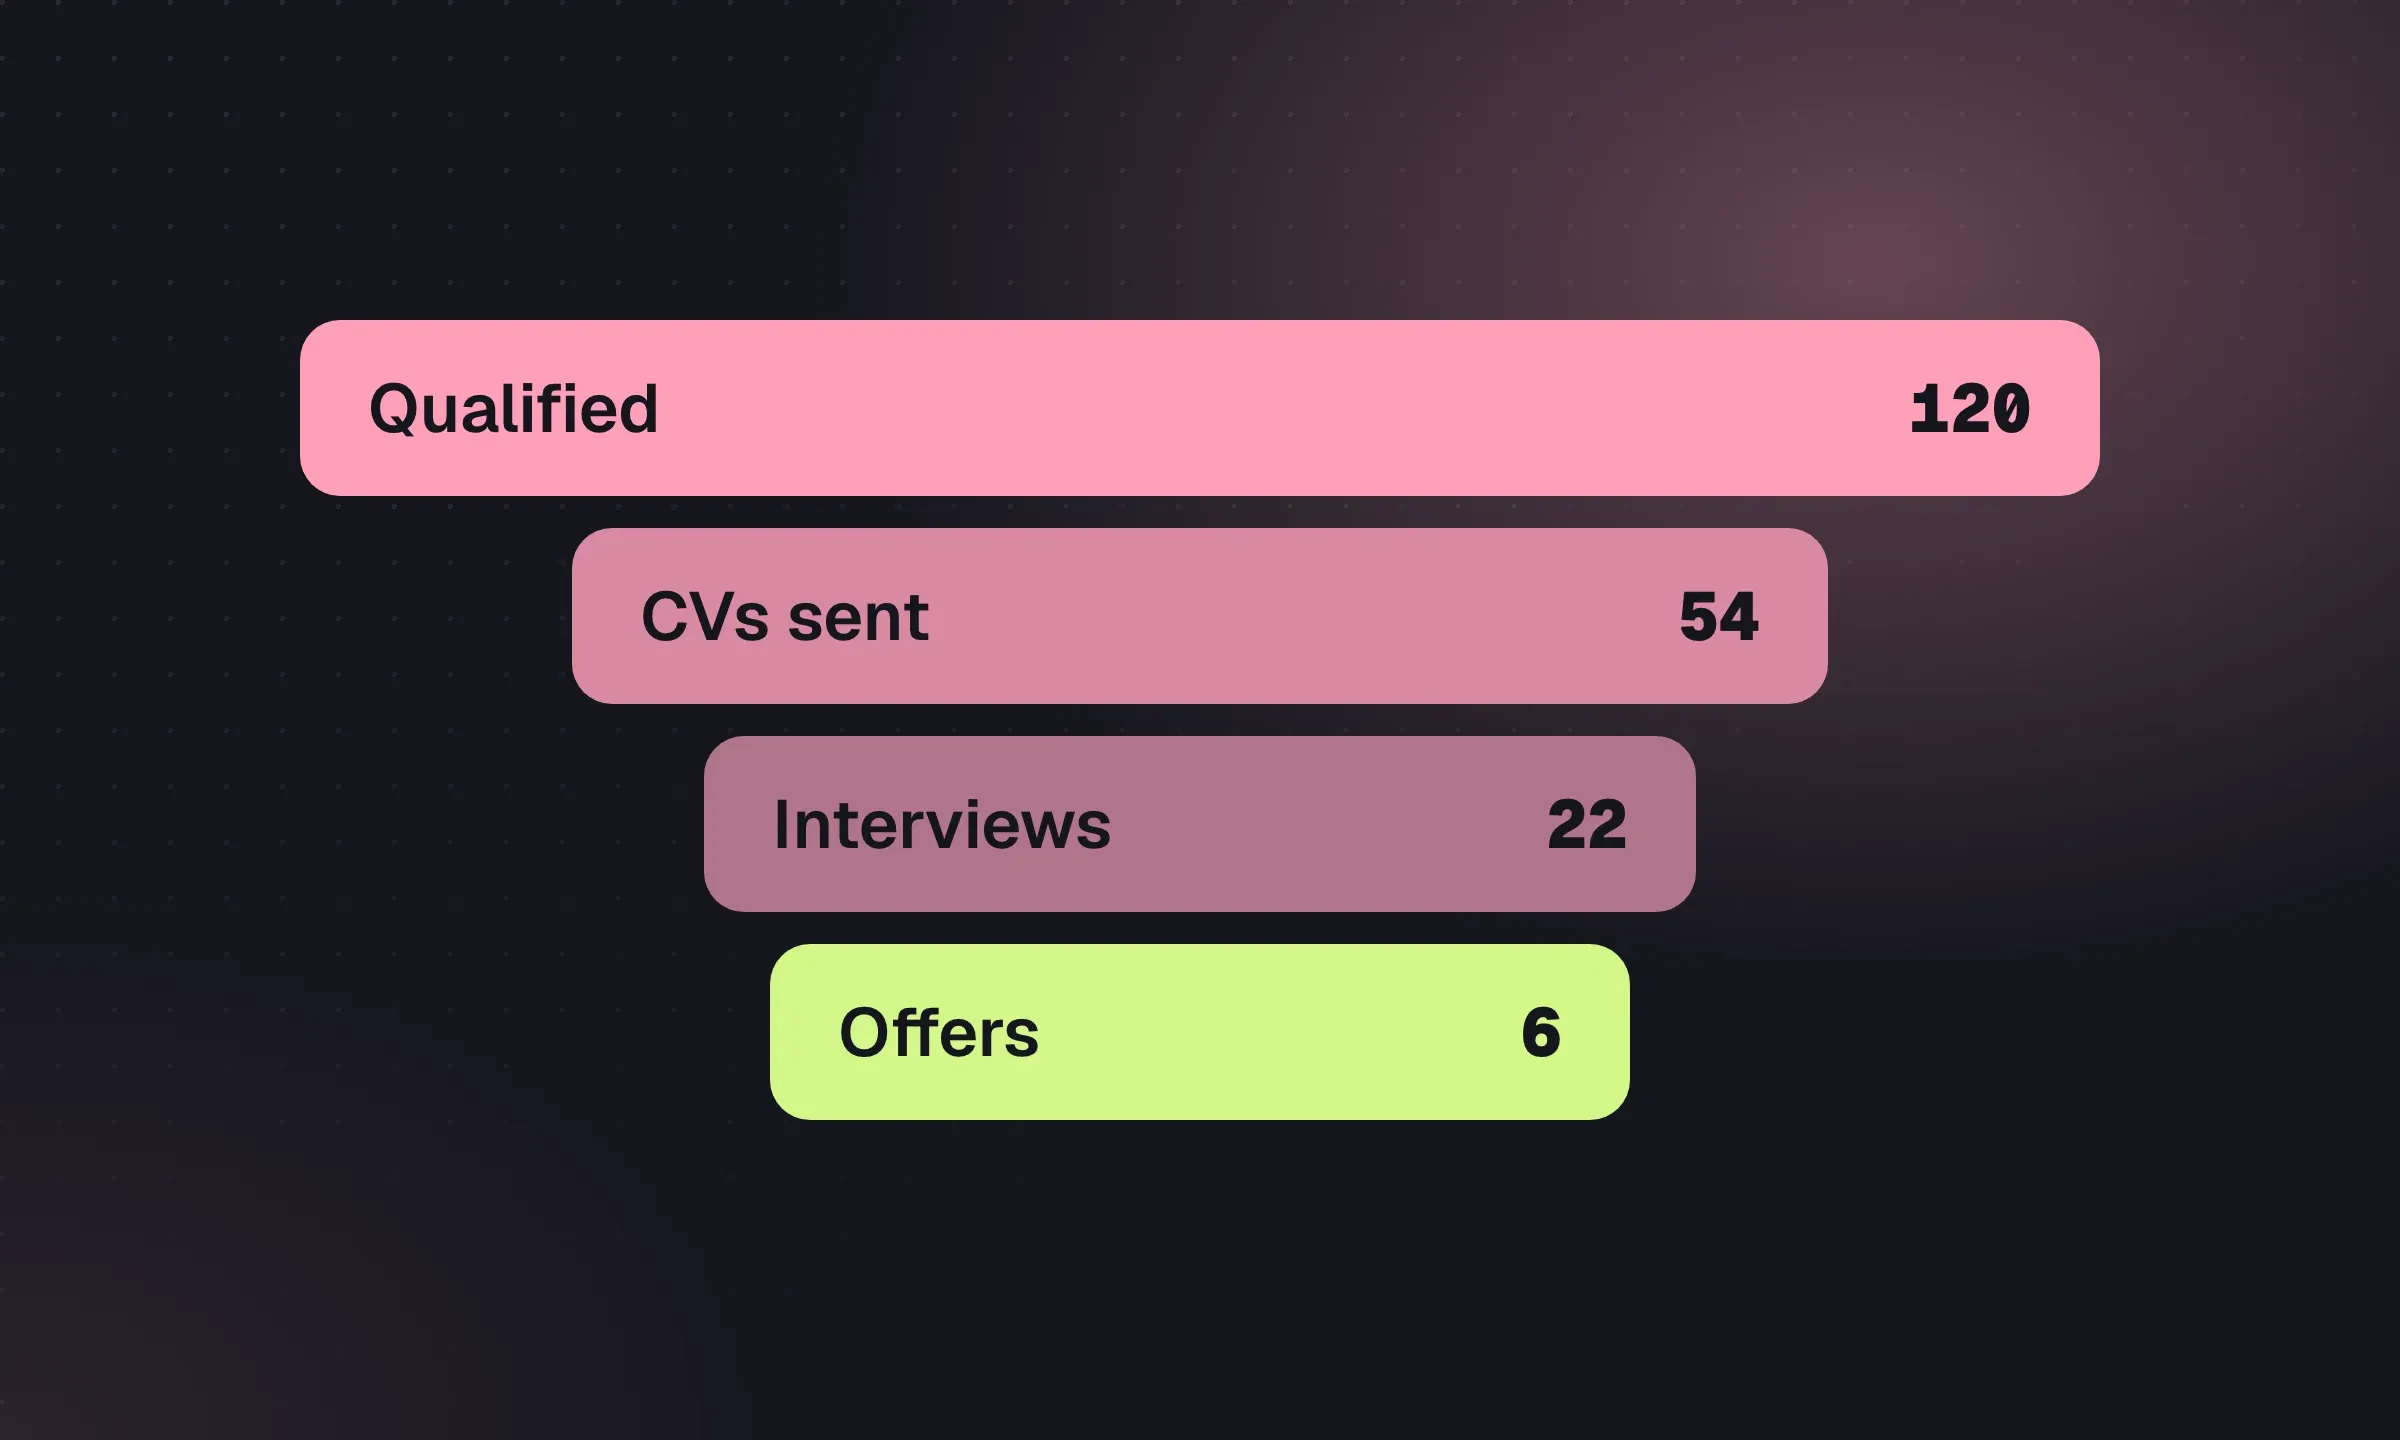
| 180 | applicants per hire in 2024, with 3% of applicants reaching interview | CareerPlug |
| 40 days | median time to hire for technical roles and 30 days for business roles, Q2 to Q3 2025 | Ashby |
| ~70% | of HR professionals still face challenges recruiting for full-time positions | SHRM 2026 Talent Trends |
Ashby’s data comes from its own customers, who lean toward tech and high-growth companies, so treat it as a direction of travel rather than an economy-wide figure. Its numbers peaked at 319 applications per hire in Q4 2024. The same report found recruiters made 7.3 hires per quarter on average in Q1 2026. In a separate Ashby analysis of hire sources, inbound applicants made up 52% of hires in Q2 2025, referrals about 18% and sourced candidates about 16%.
CareerPlug’s figures describe smaller employers hiring mostly hourly and frontline staff. Its 2025 report found job boards produced about 60% of applications. Its more recent franchise hiring benchmarks break down where hires actually come from:
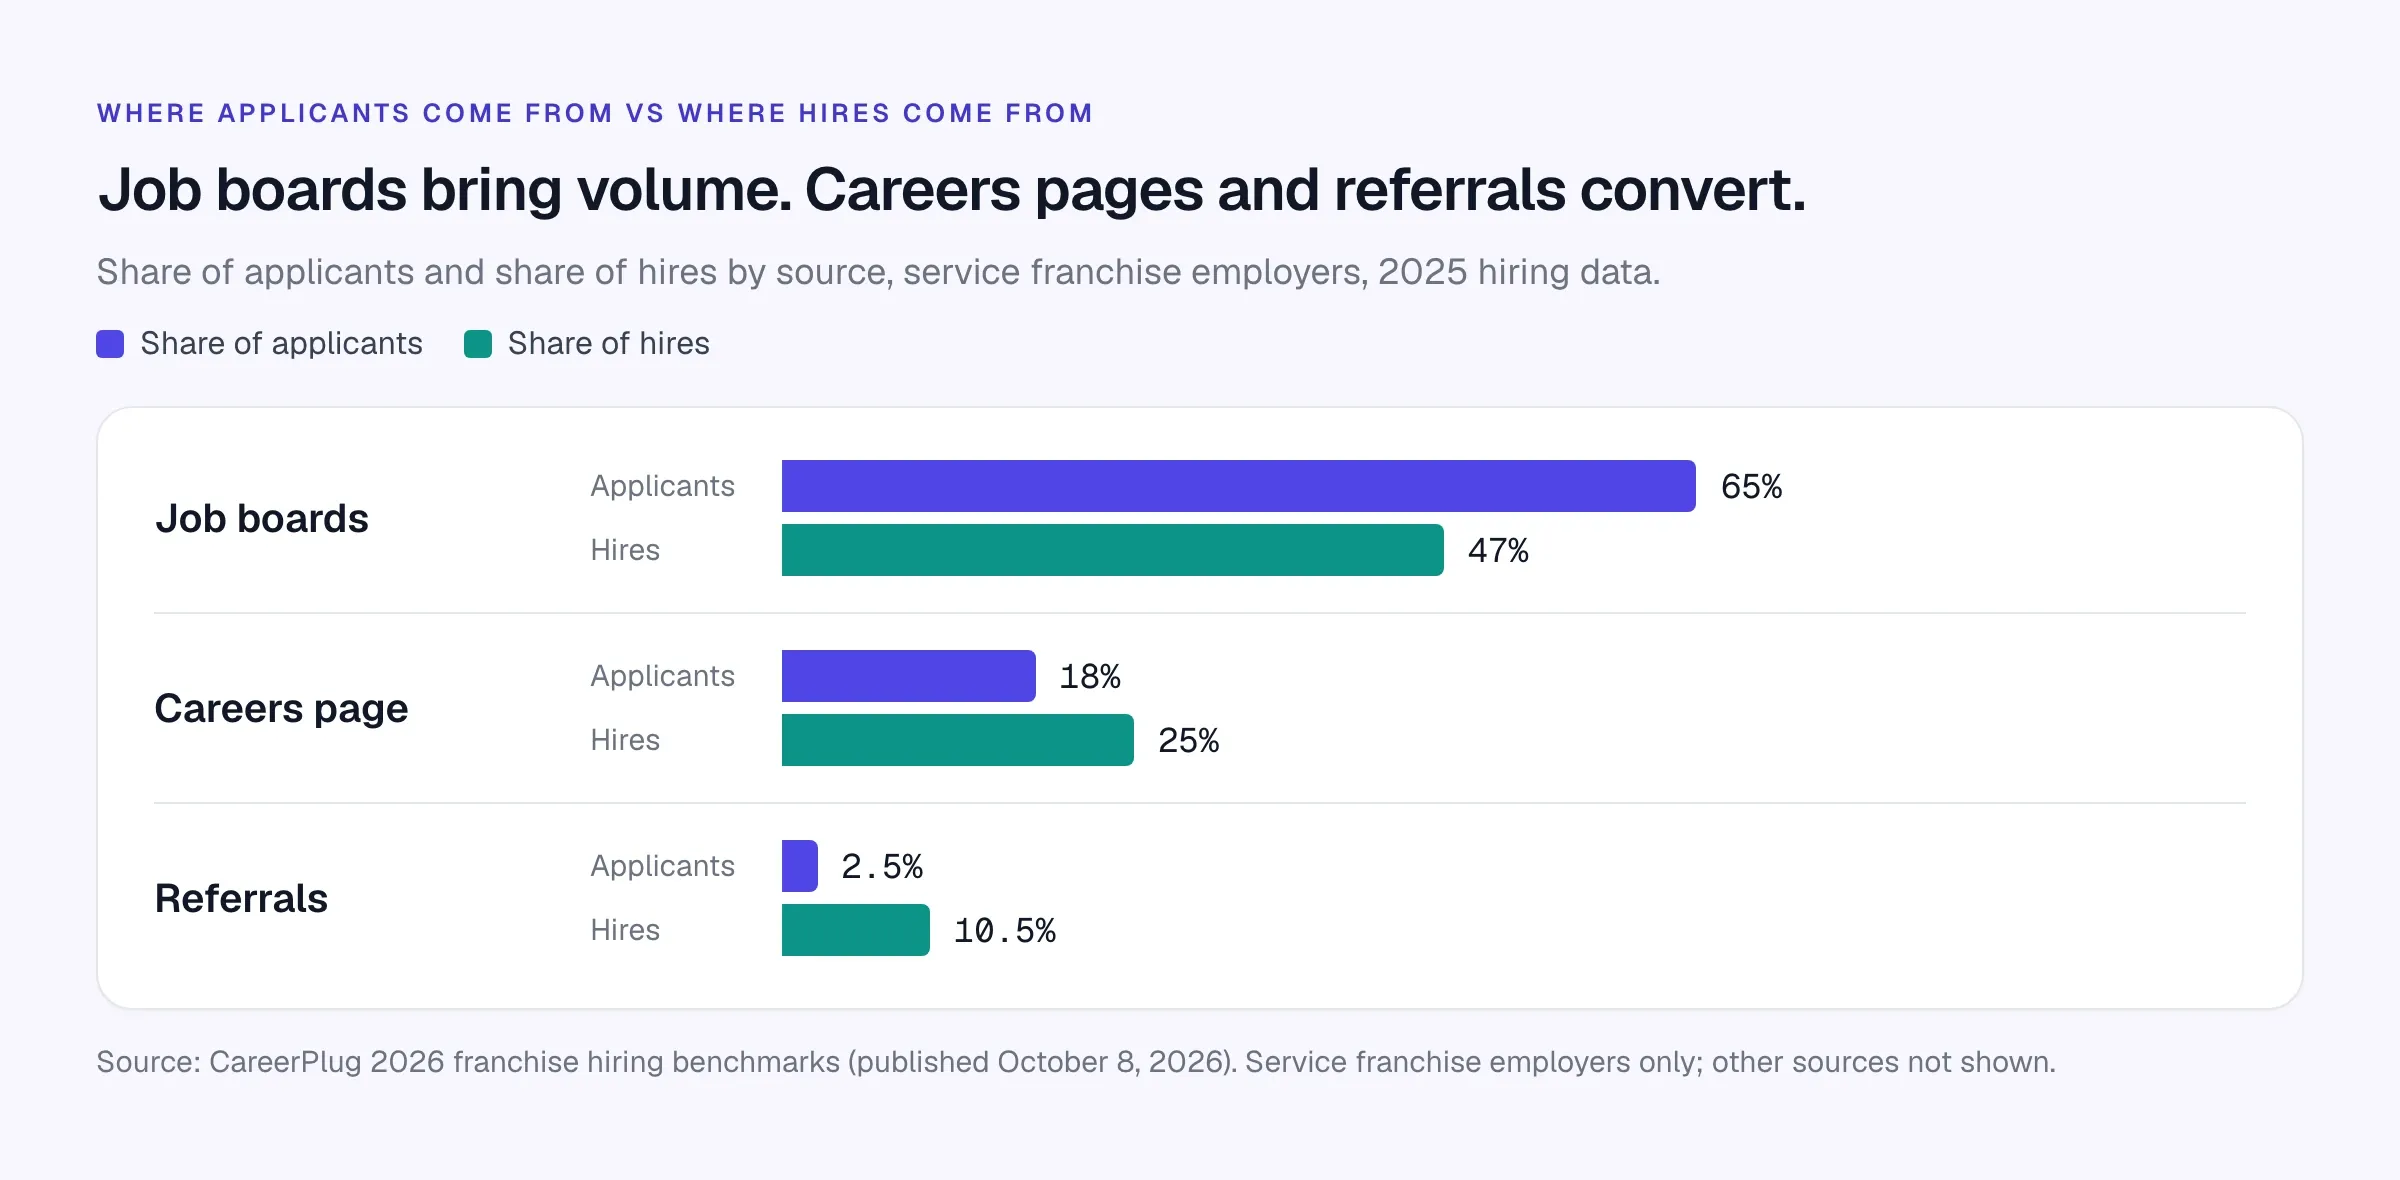
Two lessons carry over to agencies. First, volume is cheap and screening is expensive: when applications per hire triple, the bottleneck moves from attracting people to qualifying them. Search your own database before you advertise, as the candidate sourcing guide explains. Second, careers pages account for a larger share of hires than applications in CareerPlug’s franchise sample. Compare the same measures for your agency before deciding where to spend.
AI in recruiting
Scroll the table to see all columns →
| Figure | Measure and data period | Source |
|---|---|---|
| 46% | of recruitment professionals say AI cut their screening time by half or more | Bullhorn GRID Industry Trends 2026 |
| 10% | of staffing firms have implemented agentic AI across their full workflow | Bullhorn |
| 9.7% | of UK job postings mentioned AI at the end of August 2026, up from 4.9% a year earlier | Indeed Hiring Lab UK |
| 63% | of US job seekers have faced an AI interview, and 38% have abandoned a hiring process because of one | Greenhouse, May 2026 |
Bullhorn’s 2026 GRID Industry Trends report, based on about 2,300 recruitment professionals surveyed in late 2025, found top-performing firms were four times more likely to use AI, and 56% of the highest-growth firms placed candidates in under ten days. It also found 43% expected only modest economic improvement in 2026.
The candidate side is more mixed. Bullhorn’s 2026 GRID Talent Trends report found 69% of candidates had encountered AI through their staffing firm, and 92% of those interviewed by an AI voice agent rated it as good as or better than a human interview. Greenhouse’s survey found that after an AI interview, 51% of candidates never heard back. These surveys cover different experiences and populations. They give you reasons to check both reactions to the interview and the follow-up candidates receive; they do not establish one response to AI across all candidates. Bullhorn found 91% of candidates who hear from their recruiter at least weekly would keep working with them.
Earlier, LinkedIn’s Future of Recruiting 2025 report found 37% of organizations were integrating or experimenting with generative AI in hiring, up from 27% a year before, and that those using it saved about 20% of their work week.
What this means for agencies in 2026
- Check whether clients are ready to hire. Clients are still hiring, but cautiously. Qualify jobs harder (fee, timeline, decision-maker) and drop the ones that won’t close.
- Explore reasons for moving. A low quit rate is market context; ask each candidate what would make them move or stay. Dig into motivation early and prepare them for resignation.
- Screen faster than you advertise. The cited platform samples show increased inbound volume. The agency that qualifies and submits the right three people within days wins over the one that sends ten.
- Build recurring revenue where the market allows. US temp demand is edging up; a contract book smooths income when perm is slow.
- Use AI for the admin, not the relationship. Check whether automation improves response time while preserving the contact candidates need.
- Show clients the market. Quoting a current, sourced number (vacancies down, candidate availability up) is a credible opener in BD conversations. The recruitment lead generation guide has more on using market data in outreach.
Turn your careers page into a hiring channel
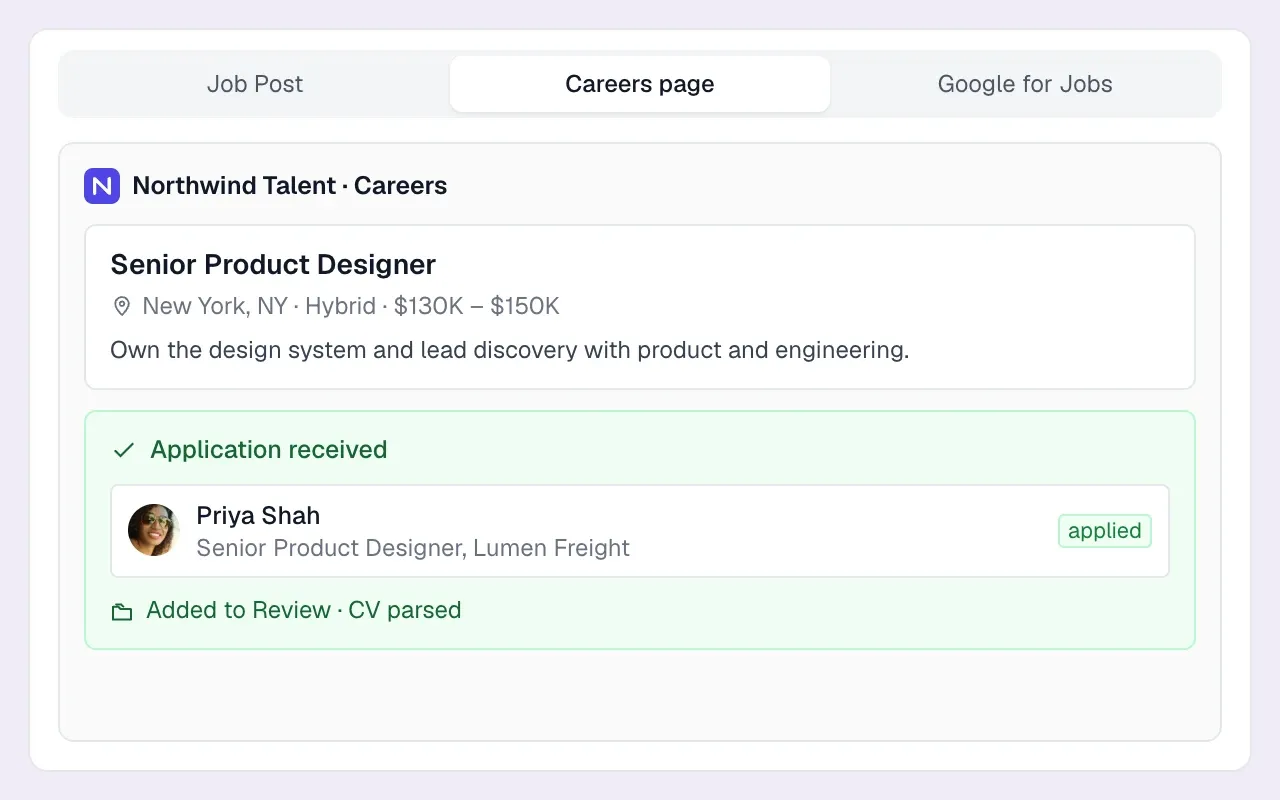
Publish jobs on your own careers page with Google for Jobs markup, and parse every applicant straight into your ATS. Careers page and CV parsing are included on every plan.
How to use these numbers
Labor-market statistics are context, not targets. They help you explain to a client why a search is taking longer, decide which desks to grow, and set realistic expectations for the year. They won’t tell you whether one consultant is performing; for that, compare people with their own history using a weekly KPI scorecard.
Three cautions apply throughout:
- Survey populations differ. A vendor survey of tech startups and a government survey of all employers can both be right and still disagree.
- Periods differ. ONS reports rolling three-month averages; BLS reports single months; vendor reports often describe the previous year.
- Definitions differ. “Applications per hire” in an in-house ATS isn’t comparable to “CVs per interview” on an agency desk.
Sources
- US Bureau of Labor Statistics: Job Openings and Labor Turnover Survey, August 2026 and Employment Situation, September 2026
- Office for National Statistics: Vacancies and jobs in the UK, September 2026 and Labour market overview
- KPMG and REC: UK Report on Jobs, October 2026
- American Staffing Association: staffing industry statistics, Q2 2026 industry update and ASA Staffing Index
- Indeed Hiring Lab: US labor market snapshot, September 2026, UK labour market snapshot, September 2026 and UK mid-year report
- Ashby: Recruiter productivity and inbound hires
- CareerPlug: Recruiting metrics report and 2026 franchise hiring benchmarks
- SHRM: 2026 Talent Trends
- Bullhorn: GRID Industry Trends 2026 and 2026 GRID Talent Trends
- LinkedIn: Future of Recruiting 2025
- Greenhouse: AI interview survey, May 2026