The KPIs that matter for a recruitment agency are the ones that predict fee income a few weeks out: BD conversations that become qualified jobs, candidates that become CVs sent, CVs that become first interviews, and interviews that become offers. Track six to ten of them per consultant, write a counting rule for each, and review them in a short weekly meeting that ends with actions on named jobs and clients.
This guide gives you the definitions, a sample scorecard, the ratios to watch, how the numbers change for 360 and 180 desks, and an agenda for the meeting itself. All the numbers in the examples are fictional and exist to show the arithmetic. They are not benchmarks.
The funnel your scorecard measures
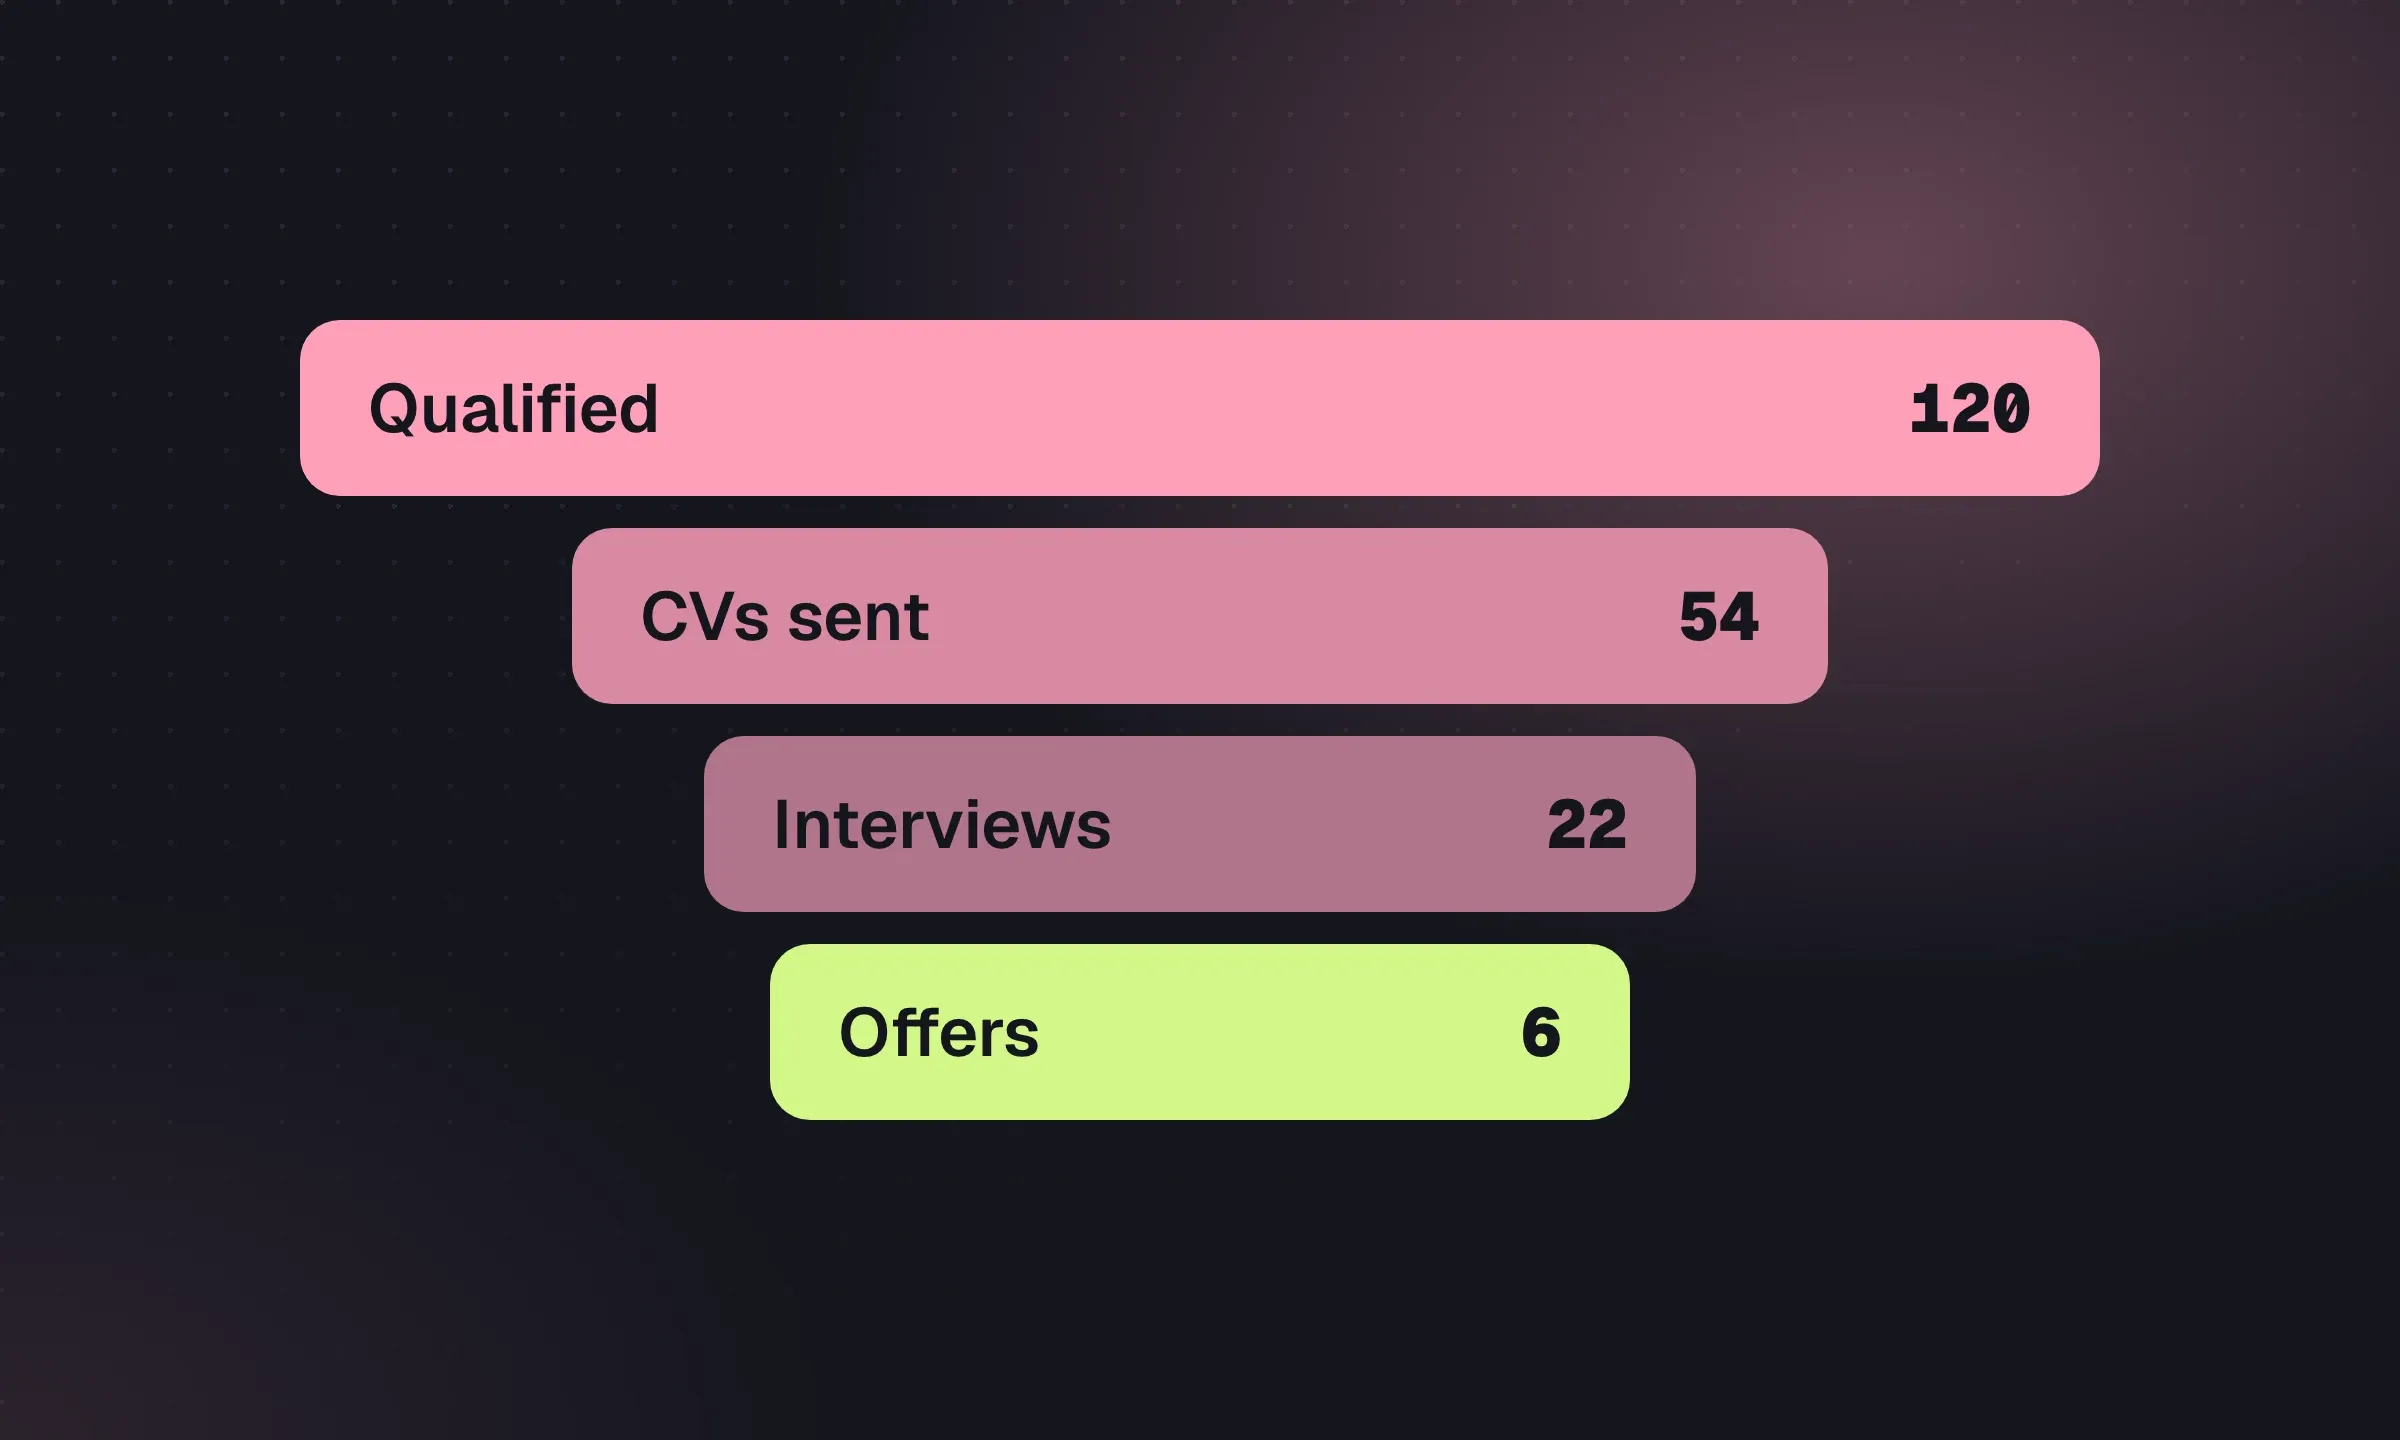
Every perm recruitment desk runs the same chain, whatever the niche. Here is one fictional consultant’s quarter on a mid-level software engineering desk:
- Candidates qualified 120
- CVs sent 54
- First interviews 22
- Final interviews 11
- Offers 6
- Placements started 5
The arithmetic: 54 CVs ÷ 22 first interviews is roughly 2.5 CVs per first interview. 22 first interviews ÷ 6 offers is about 3.7 interviews per offer. Five of six offers turned into starts, so the offer-to-start rate is 83%. If the average fee was $18,000 (20% of a $90,000 salary), the quarter produced $90,000 in placed fees.
Now the useful part. To make one more placement next quarter, this consultant needs roughly one more offer, about four more first interviews and ten more CVs sent. That turns a revenue target into a weekly activity plan the consultant can control, which is the whole point of the scorecard.
KPI definitions to agree before you compare anyone
Most scorecard arguments are really definition arguments. Settle them once, write them down and put them at the top of the sheet.
| KPI | Counting rule to agree | What it tells you |
|---|---|---|
| BD calls | A logged conversation with a hiring decision maker. Voicemails and gatekeepers don’t count | Whether next month’s jobs are being created |
| Client meetings | Held (not booked) meetings or video calls about hiring needs | Whether calls are turning into relationships |
| Jobs qualified | A live job with an agreed fee, a hiring manager you have spoken to and a timeline | Whether the desk has work worth filling |
| Candidates qualified | Screened by phone or video against a specific job, with salary, notice and motivation recorded | Delivery effort before it becomes a submission |
| CVs sent | A candidate formally submitted to a client for a specific job, with the candidate’s agreement | Whether qualified people are reaching clients |
| First interviews | Attended first interviews with the client, counted on the interview date | Whether submissions are landing |
| Offers | Written or verbal offers made by the client | Whether the late stages are working |
| Placements | Accepted offers with a confirmed start date (perm) or a started contractor (contract) | Revenue you can invoice |
| Fall-offs | Accepted placements that didn’t start or left inside the rebate period | Quality of qualification and offer management |
| Time in stage | Days a candidate has sat in one pipeline stage | Where the next action is overdue, and whose it is |
Three rules settle most edge cases:
- Count events once. A rescheduled interview is still one interview. A candidate moved back and forth between stages is still one CV sent.
- Count on the event date, in one timezone. Decide when the reporting week closes, especially if you have desks in London and New York.
- Only count what is in the system. If a CV went by personal email and was never logged, it didn’t happen for reporting purposes. This rule does more for data quality than any training session.
The ratios that matter, and the ones that mislead
Raw counts tell you about effort. Ratios tell you about quality. Calculate these monthly or quarterly, never from one week of data.
- CV-to-first-interview. The best single test of a consultant’s job qualification and candidate screening. A rising ratio (more CVs per interview) usually means the job wasn’t properly qualified, or CVs are going out without a proper conversation.
- Interview-to-offer. Tests candidate preparation, client relationship and how well the brief matches the market.
- Offer acceptance and offer-to-start. Low numbers point to counter-offers, salary expectations that were never tested, or slow clients.
- Fill rate. Jobs placed ÷ jobs worked in the period. A consultant working 15 contingent jobs and filling two has a 13% fill rate; the fix is usually fewer, better-qualified jobs.
- Exclusive or retained share. The proportion of jobs where you are the only agency or have been paid to start. It tends to raise fill rate more than any amount of extra activity.
- Average fee. Fee income ÷ placements. It drifts down quietly when consultants take low-salary roles to hit a placement number.
- Client concentration. The share of fee income from your top one and top three clients. If one client is 40% of the desk, the scorecard should say so.
The misleading ones are weekly ratios. This week’s interviews mostly come from last week’s CVs, and this week’s offers from interviews a fortnight ago. Dividing one week’s interviews by the same week’s CVs mixes cohorts. To measure real conversion, take a fixed group (all CVs sent in September, say) and follow them forward until each one is resolved.
A sample weekly scorecard
The scorecard below is for one fictional perm consultant. Leading activity sits on top, outcomes underneath, and every line has a question rather than a judgment.
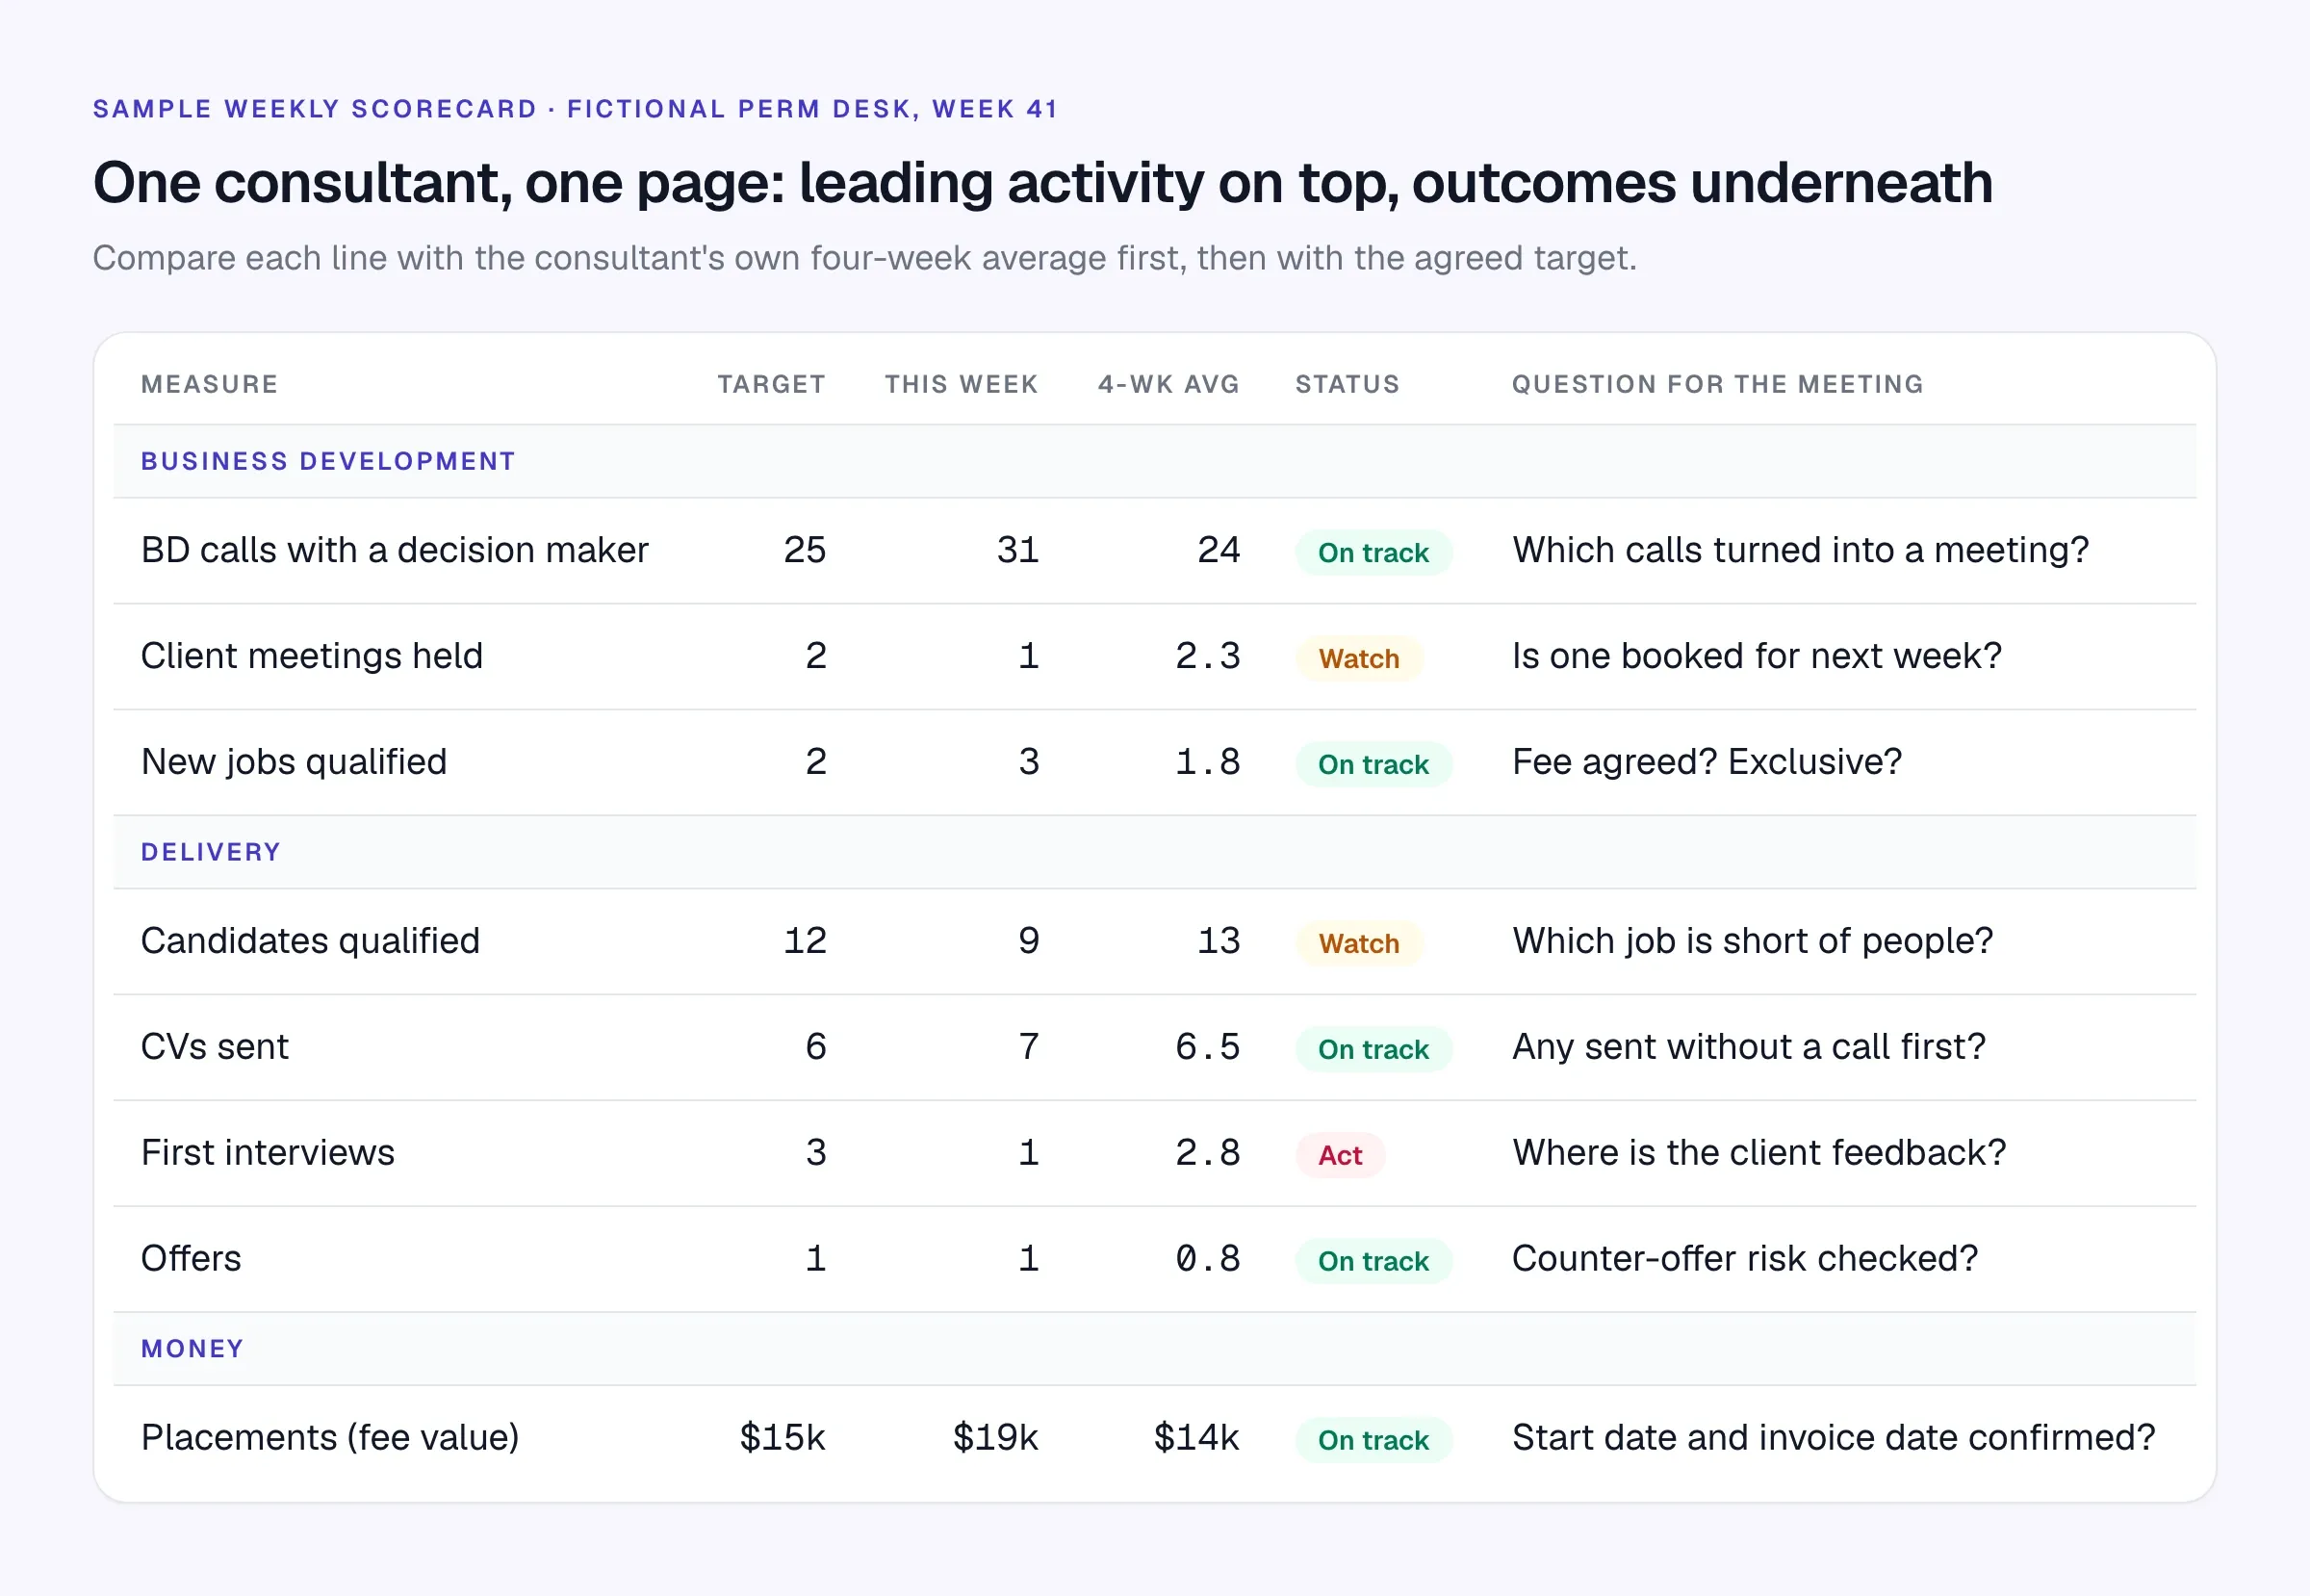
Read it the way a good manager would. BD calls are up, but client meetings are down, so the question is whether the calls are reaching the right people. First interviews dropped to one against a four-week average of 2.8, while CVs sent held steady. That points at the client side: CVs are going out but feedback isn’t coming back. The action is a call to each client with CVs awaiting feedback, not a lecture about activity.
Keep the sheet to one page. If a line has never changed a decision, delete it.
Benchmarks: use them with care
You will find plenty of “industry average” conversion ratios online. Most come from vendor marketing, small surveys or one firm’s experience, and almost none state the market, seniority or job mix behind them. A CV-to-interview ratio on an exclusive executive search assignment looks nothing like one on a contingent volume desk competing with four other agencies.
Public data is more useful for context than for targets. The recruiting statistics page collects current labor-market and staffing-industry numbers you can use to explain why a whole desk slowed down, which is different from explaining why one consultant did.
360 vs 180: who owns which number
A 360 consultant wins the client and fills the job, so their scorecard runs the whole chain. On a 180 desk, an account manager wins and manages clients while a resourcer or delivery consultant finds and qualifies candidates. Splitting the scorecard along that line avoids blaming the resourcer for a badly qualified job, or the account manager for a thin shortlist.
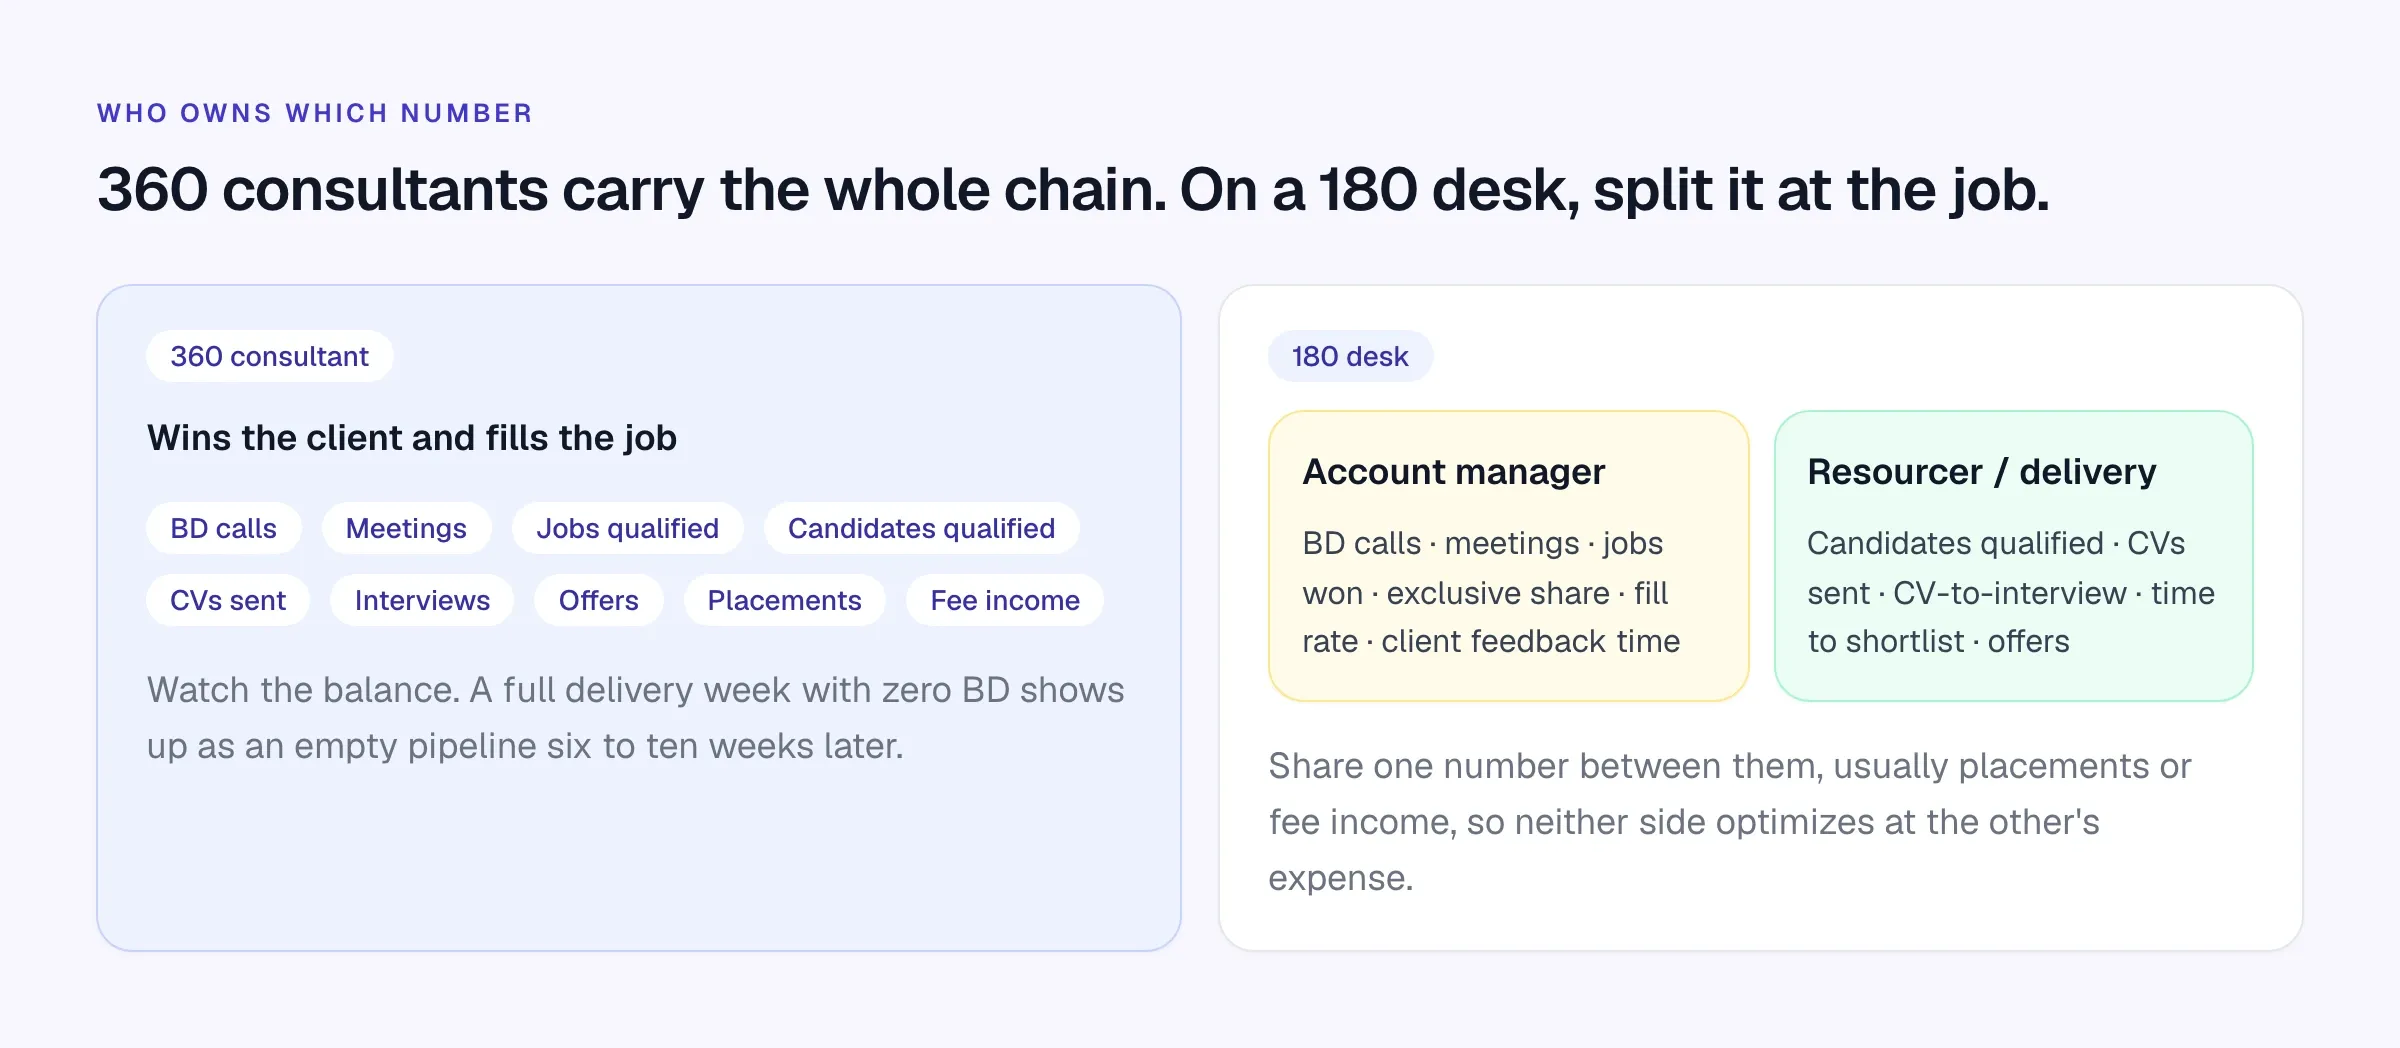
360 consultant
- BD calls, meetings and jobs qualified
- Candidates qualified and CVs sent
- First interviews, offers and placements
- Fee income against target
- The risk to watch: delivery crowds out BD for weeks at a time, and the pipeline empties two months later
180 desk
- Account manager: BD calls, meetings, jobs won, exclusive share, fill rate, days to client feedback
- Resourcer: candidates qualified, CVs sent, CV-to-interview ratio, time to first shortlist
- Shared: placements and fee income
- The risk to watch: each side hits its own numbers while the joint outcome stalls
When you move from 360 to 180 as you grow, the scaling playbook covers how to make the split and pay people fairly across it.
Business development KPIs
BD is where small agencies most often under-measure, because the work is invisible until a job lands. Track it as its own small funnel:
| BD measure | Example (fictional month, one 360 consultant) | What to watch |
|---|---|---|
| Target accounts contacted | 60 | Is the list focused on the niche? |
| Conversations with decision makers | 28 | Are calls reaching hiring managers, not just HR inboxes? |
| Meetings held | 7 | Roughly one in four conversations here |
| Jobs qualified from new or lapsed clients | 3 | The real output of BD |
| New-client fee income | $0 this month | Lags jobs won by one to three months |
The arithmetic: 28 conversations produced seven meetings (25%), and seven meetings produced three qualified jobs (43%). If this consultant needs five new jobs a month, the gap is about four or five more meetings, or around 18 more decision-maker conversations at current rates.
For scripts and channels that feed this funnel, see the guides on finding clients for a recruitment agency, cold-calling scripts for recruiters and recruitment lead generation.
Contract desk KPIs
Contract recruitment needs different headline numbers because revenue arrives weekly for as long as the contractor works.
- Contractors on billing (“heads out”). The running book. This is the contract desk’s equivalent of fee income.
- Weekly gross margin. Bill rate minus pay rate (and employer costs where you are the employer), summed across everyone on billing. A fictional example: 22 contractors at an average margin of $14/hour × 40 hours = $12,320 gross margin a week.
- Margin percentage. Margin ÷ bill rate. Watch it drift down on extensions and renewals where clients push rates.
- Contracts finishing in the next 30 and 60 days. The redeployment list. Every one is an extension conversation with the client and a new-role conversation with the contractor.
- Extension rate. Contracts extended ÷ contracts reaching their end date.
- Starts and leavers. Net change in heads out per week tells you whether the book is growing.
If you run a mixed desk, keep contract and perm on separate scorecard sections. A consultant with 30 contractors out and no perm placements may be the most valuable person on the team. The contract recruitment software page shows how bill and pay rates, start dates and extension reminders sit on the placement record in Longlist.
How to run the weekly KPI meeting
Thirty minutes, same day and time every week, with the scorecard sent the afternoon before so nobody reads numbers for the first time in the room.
- Set the window (2 minutes). Same reporting week for everyone, closed at the same time. Note anything unusual: a bank holiday, a consultant on leave.
- Scan the team view (5 minutes). Look for lines more than 30% away from each person’s own four-week average. Ignore small wobbles.
- Open the records behind the outliers (10 minutes). A drop in interviews is a list of CVs awaiting feedback. Open it and decide who calls which client today.
- Review stuck jobs (5 minutes). Sort open jobs by time in stage. Anything with no movement for ten working days gets an owner and a next action, or gets parked honestly.
- Check next month’s work (5 minutes). New jobs qualified, BD meetings booked and opportunities with a close date in the next 30 days.
- Write down three actions (3 minutes). Named owner, named job or client, due date. Review them first next week.
Weekly KPI meeting agenda
Weekly KPI review — [Team] — week ending [date]
Reporting window: [Mon 00:00 – Fri 23:59, timezone]
Sent to the team: [day before, 4pm]

1. Notes on the week (leave, holidays, data issues)
2. Lines more than 30% off each person's 4-week average
   - [Consultant] – [measure] – [this week] vs [avg] – records opened: [job/client]
3. Stuck jobs (no stage movement in 10 working days)
   - [Job] – [client] – [stage] – next action – owner – date
4. Next month's pipeline
   - New jobs qualified: [n]  |  BD meetings booked: [n]  |  Opportunities closing in 30 days: [n]
5. Actions (max 3)
   - [Owner] – [action] – [job or client] – [due date]
6. Last week's actions: done / not done / whyWhere the numbers come from
A scorecard only works if the numbers fall out of the work the team is already doing. If consultants have to fill in a spreadsheet on Friday afternoon, you will get estimates and gaps.
In Longlist, recruitment reporting builds four standard reports from activity recorded during the week: User Activity (CVs sent, interviews, offers, calls and pipeline moves by recruiter), Client Activity (open pipeline, time in stage and archive reasons by client), BD Activities (new contacts, campaign additions, calls and opportunities) and Jobs. Click any count to open the candidates, jobs and clients behind it, which is exactly the drill-down step 3 of the meeting needs.
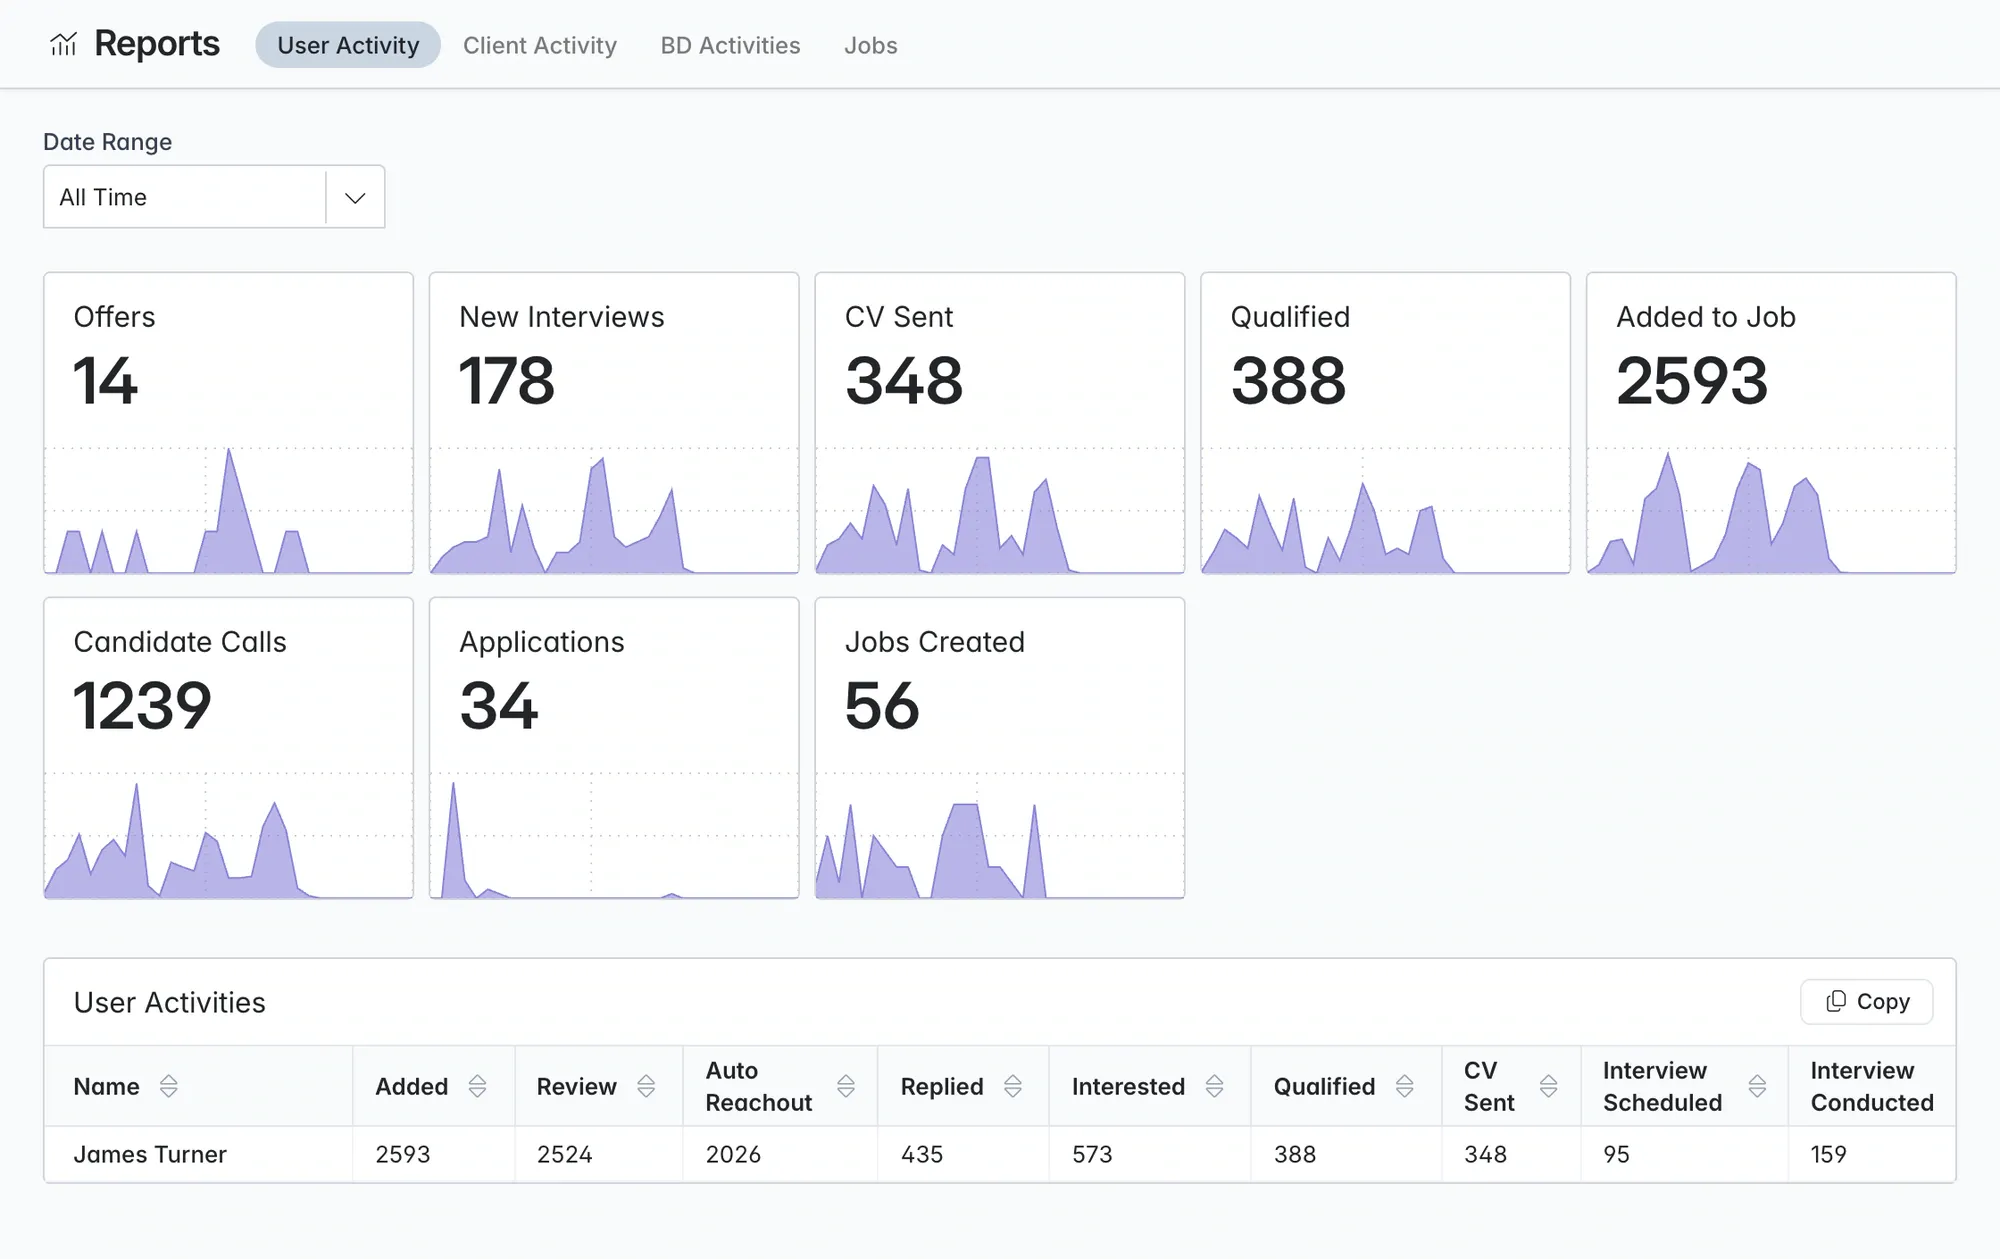
Two cautions. First, keep fee income and margin reconciled with your finance or billing records; placement details in the CRM are a reference, not your ledger. Second, if you are moving from another system, historic activity may not map one-to-one, so restart trailing averages from the go-live date. The CRM migration checklist covers how to plan for that.
Run your weekly KPI review in Longlist
See the four standard reports, the drill-down and how a weekly review runs on recorded activity rather than a spreadsheet.
Getting the inputs right
The cleanest scorecard is built on clean records. A few habits make a large difference:
- Log CVs sent from the job, not from your inbox. Use a consistent candidate submission template so every CV sent is a recorded pipeline move with a cover note.
- Record archive reasons. “Client rejected: salary” and “Candidate withdrew: counter-offer” are the data behind your interview-to-offer and offer-to-start ratios.
- Log calls against the record. Calls that never touch the CRM make BD invisible. On Longlist Plus, click-to-call from the record logs the call where the scorecard can count it.
- Keep opportunities on a board. A BD pipeline with values and close dates gives you the “next month’s work” line. The business development workflow keeps companies, contacts and opportunities next to the candidate work that follows.
If your current tools make any of this hard, the recruitment CRM vs ATS guide explains which parts of the job each system should hold.